

LLM observability and monitoring: watch what a model does once it is live
An LLM feature needs monitoring that evaluation alone cannot give it: a trace of every request, a sampled quality score against the rubric you tested with, drift and safety signals on live output, latency and cost per request, and an alert path that reaches a named owner before a quiet failure becomes a visible one.
Submit a project Quality, security and AI assuranceReviewed by Huy Nguyen (David), CEO · Updated 6 Oct 2026 · 11 min read

OutsourcingVN is operated by Netbase JSC, which builds AI workflows and the gates they ship through, so this guide comes from a supplier with an interest in your project. It is written for CTOs, engineering leads and AI product owners who have already evaluated the feature before launch — the AI workflow evaluation and testing guide covers that pre-release work — and now need to watch it in production. Where the need is standing telemetry and gates rather than a one-time build, the quality, security and AI assurance service runs this discipline continuously, wired into the release pipeline.
Contents
- Why isn't the evaluation set enough once a feature ships?
- What should you trace and sample on every request?
- How does a threshold breach become an incident, not just a chart?
- What should run on every production request?
- A worked scenario: a returns assistant two weeks after launch
- What has Netbase delivered with monitored AI systems?
- Which questions should you ask a monitoring supplier?
- What failure modes should you watch for?
- How this guide is sourced
- Common questions
- Bring the dashboard, not just the brief
Why isn't the evaluation set enough once a feature ships?
An evaluation set is built from a sample of past traffic and judged once before launch; the AI workflow evaluation and testing guide covers building it well. Production traffic does not hold still: a model provider changes a hosted model, a prompt is edited, an upstream data source drifts, or users simply ask different questions than the sample contained. None of that shows up until something is watching the live system, which is the same discipline the software reliability and incident readiness guide sets out for any live system — naming an owner, routing alerts and rehearsing the response. An LLM feature adds four signals most systems do not carry: a sampled quality score, drift and safety flags, a cost per request that can move independently of traffic volume, and an output that changes in ways a stack trace cannot show.
What should you trace and sample on every request?
Five signal categories cover most LLM features; which ones carry the most weight depends on what the feature does.
| Signal | What it captures | Where it comes from | Typical alert |
|---|---|---|---|
| Request trace | The prompt, retrieved context, tool calls, the output and a latency breakdown | Application and model-call logs | A trace is missing or truncated |
| Quality sampling | A scored subset of live requests judged against the same rubric used before launch | The evaluation set's criteria, replayed on a sample of live traffic | The sampled score drops against the agreed threshold |
| Drift and safety signals | Policy violations, refusal rate and the categories that moved most since release | Safety classifiers and policy checks run on live output | The flag rate rises over a rolling window |
| Latency and cost per request | Time to first token, total latency, and tokens in and out | Request timers and the model API's own usage figures | Latency or spend moves outside the agreed range |
| Errors and refusals | Timeouts, tool failures and declined answers | Application logs and the model API's response | The error rate rises above its baseline |
A captured trace often carries the same personal data the request itself carried, so access to it follows the same control as production data: Netbase security practices include secure code review and version control, role-based access control, MFA for admin dashboards, contributors under NDA, and NDAs and DPAs on request. Where the feature can also call a tool, trace capture should log the tool call and its inputs alongside the model output, which is the same evidence the AI agent tool permissions guide asks a red-team case to test against. A confirmed safety flag is also a candidate for the case library the AI assurance and red teaming guide maintains before launch, so a finding here should feed back into that round as well as into this page's regression set.
How does a threshold breach become an incident, not just a chart?
A dashboard nobody watches is not monitoring. Each signal above needs a named owner, a channel that pages them, and a written response for what happens next, which is the discipline the software reliability and incident readiness guide sets out in full; an LLM feature joins the same rotation rather than starting a second one. Where coverage must hold outside your own team's hours, Netbase's own Hanoi office works Monday to Saturday, 9:00-18:15 Vietnam time (UTC+7), and support coverage follows those days, so an incident plan built with Netbase states the handoff outside that window explicitly. Where the feature needs a standing owner rather than a one-off build, Netbase also offers dedicated development teams, on-demand support and fully managed delivery as secondary options, which is the entry point for managed operations. A threshold breach that would stop a release going out at all is the software release readiness checklist's concern; this page is what runs after that gate has already passed, on every request the gate let through.
What should run on every production request?
-
Capture the trace
Log the prompt, retrieved context, tool calls, the output and a latency breakdown for every request, not a sample.
-
Score a sampled subset
Run a slice of live traffic through the same rubric the evaluation set used before launch.
-
Run drift and safety checks
Classify the output for policy violations, refusals and the signals that moved most since release.
-
Check against the agreed thresholds
Compare the sampled score, the safety flag rate, latency and spend against the limits agreed before launch.
-
Decide: continue or page the owner
Inside the thresholds, log the result and continue; outside them, page the named owner.
-
Keep watching: log and continue
Requests inside the thresholds join the ordinary log, not an incident channel, and the loop runs again on the next request.
-
Re-run the full check on a fixed schedule
Even with no threshold breach, replay the whole evaluation and safety set on a schedule, since drift can be gradual.
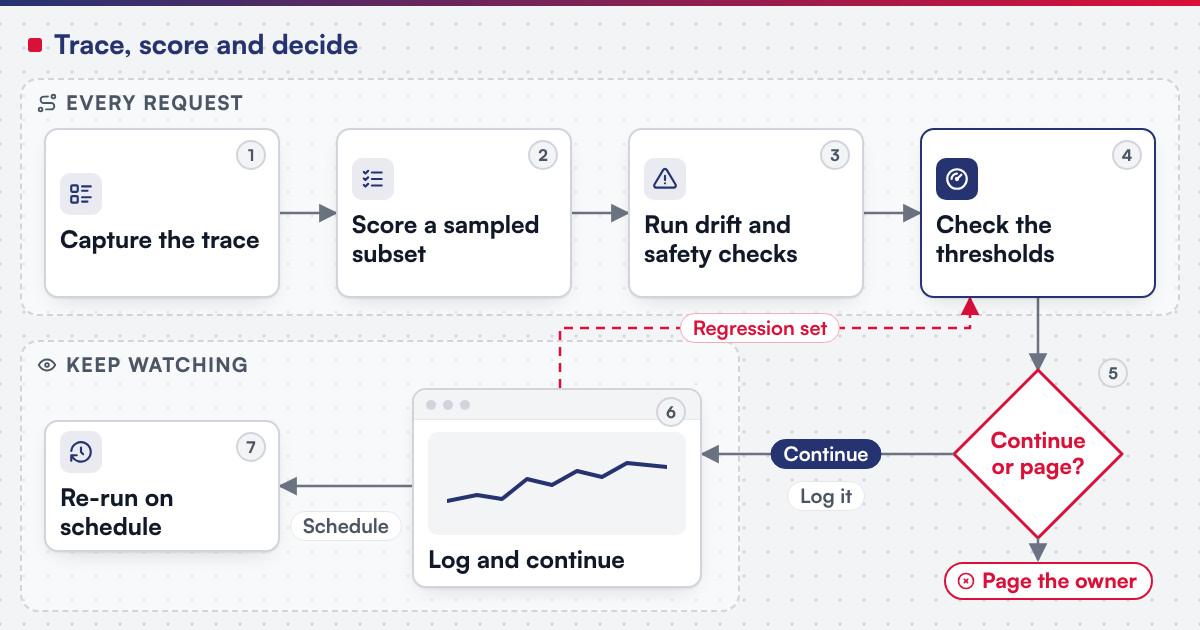 (opens the full-size diagram in a new tab)
A worked scenario: a returns assistant two weeks after launch
A retailer's returns assistant launched with a clean evaluation run and a red-team round behind it. The scenario is illustrative and describes no client.
Two weeks in, the sampled quality score holds steady, but the safety classifier's flag rate on one category rises from a handful a week to a dozen in a day: a customer asking the assistant to approve a discount it has no authority to give. The threshold check alerts an on-call engineer, who reads the flagged traces and confirms the assistant never approved a discount, only answered as if it might, a near-miss nobody had tested for before launch. Wording is tightened to decline clearly and route the request to a person, and the case joins the regression and safety set so the next release is tested against it. A separate alert the same day flags latency: one in twenty requests through a retrieval call runs slow, traced to a connection pool limit rather than the model itself, and the fix ships within hours. Neither finding would have shown up in the evaluation run that preceded launch, because neither pattern existed in the sample it was built from.
What has Netbase delivered with monitored AI systems?
Netbase works with language models from OpenAI, Anthropic (Claude), Google (Gemini) and Meta (Llama), among other commercial and open-weight models, chosen per project (model-agnostic). Netbase has delivered anonymised client AI projects including retrieval-based knowledge assistants, document AI and MLOps pipelines. The published example closest to a monitored, moderated AI feature is a classifieds platform: it used AI-powered content filtering that detects and flags offensive content into an admin moderation dashboard. That shape — a model's output reaching a queue a person checks, with the flag rate itself worth watching — is the pattern this page generalises into traces, thresholds and an incident path, and the WhatsApp AI chatbot CRM integration record is a second published example. Netbase applies the ISO/IEC 42001 AI management system framework to its own AI delivery practice.
Which questions should you ask a monitoring supplier?
-
What traces are captured, and for how long?
Prompt, context, tool calls and output, retained long enough to investigate a complaint
-
How is the evaluation set reused in production?
The same rubric, replayed on a live sample, not a new unrelated metric
-
Who is paged, and on what schedule?
A named owner and the hours the response commits to
-
What happens to a confirmed finding?
A fix outside the prompt where possible, and a permanent regression and safety case
-
Does this replace the pre-release evaluation?
No; it is what runs after that evaluation, continuously
What failure modes should you watch for?
- Dashboards nobody owns. Signal: alerts fire into a channel nobody reads. Fix: name an owner before the feature ships.
- Thresholds set once and never revisited. Signal: the same limits run for months while usage changes. Fix: review thresholds on the same schedule as the regression re-run.
- Safety signals only on chat input. Signal: no checks on tool results or retrieved content. Fix: extend classifiers to every content source the model reads.
- Cost watched monthly, not per request. Signal: a spend spike is found on the invoice, weeks later. Fix: alert on spend per request, not only the total.
- A confirmed finding never joins the regression set. Signal: the same failure recurs after a later change. Fix: every confirmed case becomes a permanent test.
How this guide is sourced
The signal catalogue draws on NIST's Generative AI Profile (NIST AI 600-1, July 2024) and OWASP's entries on misinformation and unbounded consumption, each dated under Sources. Statements about Netbase come from attested company facts listed under Sources. The returns-assistant scenario is illustrative. The related published records are the classifieds moderation dashboard and the WhatsApp chatbot integration; monitoring design is offered as a scoped engagement.
Plan the next step for your project
Common questions
No. An evaluation set is a sample judged once; monitoring asks the same questions continuously on traffic the sample never saw.
Someone reviews the alert channel and the weekly or monthly trend, not every request; the named owner from the software reliability and incident readiness guide usually takes this on alongside other live-system alerts.
Not always. Classifiers tuned to a company's policy can usually be reused across similar features, revalidated whenever the policy or the feature's scope changes.
Treat it as any other change: re-run the evaluation and safety set before trusting the new behaviour, and alert on any shift in the sampled score or the flag rate afterwards.
Yes. A model can answer quickly and still cost more than planned if it reads more context or calls more tools than expected, so spend and latency should alert independently.
Bring the dashboard, not just the brief
A first conversation goes furthest with the feature's evaluation set, the thresholds you would set if you had to guess, and the name of the person who should be paged first. Submit a project with them, or start with the quality, security and AI assurance service if the gates do not exist yet. OutsourcingVN is Netbase's own outsourcing-services platform.
Work behind this guide

Netbase delivered a bilingual classifieds marketplace, in English and Nepali, with paid ads, search, messaging, payments and an AI filter that flags offensive content into an administrator review queue. The client is not named, and no traffic, accuracy or commercial result is claimed.
Keep Reading
The client, sector, region and CRM product are not named, and no conversation volume or business result is claimed.
Keep ReadingRelated services and solutions
 Quality, security and AI assurance: the gates a release must pass
Standing test, security and AI-evaluation gates wired into your release path.
Learn More